
“The stock market serves as a relocation center at which money is moved from the active to the patient.”
After a strong start to the year in January, volatility returned with a vengeance in early February just as our new Federal Reserve chairman, Jerome Powell, took control of the central bank. The entry of a new Fed chairman was followed by two high-profile exits in the Trump administration: economic advisor Gary Cohn and Secretary of State, Rex Tillerson. Markets prefer certainty, and with both Cohn and Tillerson gone, many now believe there isn’t anyone left to keep President Trump in check. Additionally, investors are losing faith in markets as President Trump ramps up his combative anti-trade rhetoric.
In Brief:
The 10-year treasury finally hit 3% this week — the first time since the taper tantrum of 2014. Algorithms “sold the news” and set into motion a further sell-off to start Q2.
Markets now fear that the Fed will raise rates at least three more times in 2018, pushing the economy into recession in 2019. Contrary to consensus, I believe the Fed will raise rates only twice in 2018 and is under no pressure to aggressively lift interest rates.
Many research analysts contend that the boosts from Trump’s tax cuts are largely priced into the market and the highs were made in January. It's easy to factor in new corporate tax rates but future demand expectations are always difficult to forecast. Cambridge Wealth Management’s year-end target for the S&P 500 for 2018 remains 2850.
Volatility is baaack. In January, I mentioned that the “FAANG Stocks “focus (Facebook, Amazon, Apple, Netflix, and Google) remains a worry for me in 2018. The relentless advance in the market in 2017 was largely fueled by a handful of glamorous mega-caps. In fact, a recent analysis shows that nearly 40% of last year’s gain in the S&P 500 can be linked to just four stocks.” New York Times contributor, Norm Alster, pointed out in a January 12, 2018 article (click): “FAANG stocks made up just 6 percent of the S.&P. 500 in 2013. By the end of last year, they accounted for 12.3 percent.”
As Facebook and Google face the potential for new regulations to protect consumer privacy and prevent suspected foreign intervention in our future elections, volatility in the FAANG stocks has picked up and exacerbated moves to the downside in the market indices. In a September 2017 post on the Cambridge Wealth Management Facebook page, I shared the following quote: "The gross idolatry, or mother of all hall passes, that big tech has received from government and from regulators is coming to an end," NYU Stern School of Business professor Scott Galloway told CNBC's "Squawk Alley.”
Currently, the market is searching for new leadership as the once invincible FAANG Stocks have met their kryptonite: potential government regulations. The prospects of increased regulation for social media companies and tight labor markets are giving investors reason for pause because it means changes in future earnings that result in diminishing risk-adjusted returns. And it couldn’t come at a worse time as the list of political obstacles for the market continues to pile up, such as a potential Democratic sweep in the November midterm elections and a trade war with China. With so much uncertainty, we are simply entering a period of “risk-off” in global markets. We are not entering a recession or a bear market.
According to the Investment Company Institute, outflows from U.S. equity mutual funds and exchange-traded funds totaled $41.3 billion in February. That's the most by a dollar amount since a $42.8 billion outflow in January 2008. So, while earnings are failing to impress investors and the markets show continued signs of volatility, I believe reduced burdensome regulations, lower tax rates, higher wages, improving corporate and personal balance sheets means the market’s best days are in front of us. Just as in Q1 2018, a record number of S& P companies are beating earnings again. Check out these recent numbers published on April 23 by John Butter’s of Fact Set:
“It appears the lower tax rate is more than offsetting any impact of higher wages and other rising costs, resulting in a record-level net profit margin for the index for the first quarter. It is interesting to note that analysts expect even higher net profit margins for the remainder of 2018 for the S&P 500. Based on current earnings and revenues estimates, the estimated net profit margins for the second, third, and fourth quarter of 2018 are 11.5%, 11.8%, and 11.7%, respectively.”
Inflation Concerns

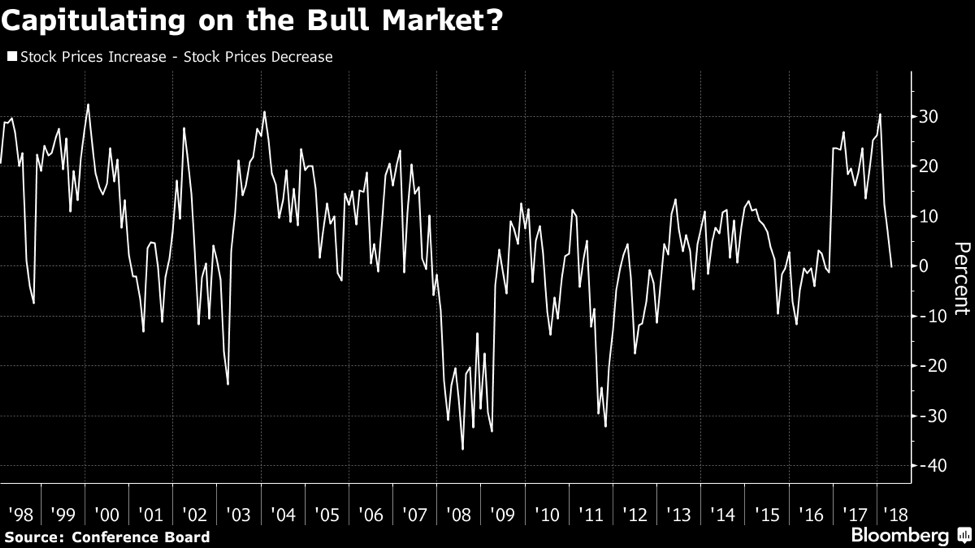
From 2014 to 2016, inflation expectations tumbled as the oil glut and the Saudi's efforts to drive U.S. producers out of business pushed crude below $30 by early 2016. The recovery in the price of oil helped fuel gains in 2017 but it appears the high is now in for oil and its presenting a headwind for further market gains. Oil should resume its longer-term trend lower over the next few years. The graph above illustrates that inflation concerns over the near-term maybe overblown. However, the headline is changing. For years, our Fed was worried about deflation, and now it’s focus is shifting to inflationary concerns.
Historically, in the late stages of a bull market, the economy shows signs of overheating, inflation continues to climb higher, stock prices look expensive compared to earnings, and the Fed continues to raise rates aggressively. Late-stage cycle sectors to invest in include energy, utilities, healthcare, and consumer staples. Other than a recent surge in energy stocks, healthcare and consumer staples sectors are performing poorly. Therefore, it does not appear that we are in the 7th, 8th or 9th inning of a late-stage bull market (many pundits like to use this baseball terminlogy to describe market cycles). The length of this bull market (as compared to previous bull markets) is an irrelevant comparison.
Famed investor Louis Navellier sums up the performance of the markets since 1999 in a January 2018 Seeking Alpha post titled: “The S&P 500 has gained only 3.4% since 2000.” In it, he notes:
“When pundits talk about the soaring stock market this year, last year, and the last nine years, they forget to mention the nine dismal years before 2009. If you take the full 18 years from the end of 1999 to the end of 2017, the S&P 500 has only risen 82%, which works out to only 3.4% per year, annualized.”
Over the past decade, America has experienced the weakest economic recovery in history. GDP growth averaged 1.26%, worse than the Great Depression’s growth rate of 1.37%! (Granted, not a fair comparison but I thought it was worth noting). There is plenty of room for improvement going forward as American’s experience improved wages for all, not just the top 1%.
Fixed Income

A market milestone is reached this week - 3% 10-year treasury
Markets are now concerned that our new Fed chairman, Jerome Powell, will prove to be a “hawk” and aggressively raise interest rates. Many financial experts point to the flattening yield curve as a leading indicator of a looming recession or "soft patch" in 2019. The economy is getting unprecedented fiscal stimulus from the Tax Cut and Jobs Act of 2017 at a time when the Fed is raising rates, and the federal debt has begun spiraling upward.
*For a deeper explanation of the "yield curve tell," check out this piece by me posted in February 2017.
Contrary to Wall Street’s consensus view, I think the Fed will raise rates only two times this year. While inflation, wage growth, and the economy show signs of picking up, it’s not overheating, allowing the Fed to gradually raise rates this year and in 2019.
Additionally, both the European Central Bank and the Bank of Japan are not planning rate hikes, and their buying of our treasuries along with foreign capital seeking better returns could put a lid on further rate increases for the balance of the year.
My view is that the 10-year Treasury yield could rise to 3.5% within a year as the Fed follows a steady and slow path of tightening.
At Cambridge Wealth Management, we continue to favor a short-duration laddering strategy of investment-grade corporate bonds and CDs on the short-end. Investors are finally getting paid to hold CDs as 6-month paper approaches 2%. And select 2023 BBB-rated financial paper is close to yielding 4% again.
Note on Municipal bonds: The new $10,000 limits for deducting state tax against one’s Federal tax makes municipal bonds even more attractive to wealthy individuals living in high-tax states like California, Connecticut, New York, New Jersey, and Maryland. The two categories that look are appealing within the muni space are the top ten U.S. ports and airports.
The Bottom Line:
So far this earnings season, a lower tax rate for corporate America is more than offsetting any impact of higher wages and other rising costs, resulting in a record-level net profit margin. But given the recent breakdown in leadership from the FAANG group, concerns over mistakes by a new Fed Chairman, and ever-changing, worrisome tweets from our president, the market has a reason for pause as it sells the good news and reevaluates risk premia. However, I remain reasonably optimistic on the market with a year-end target of 2850 for S&P 500.
From a technical standpoint, the U.S. market is showing signs of support at S&P 500 2600 and further downside risk seems muted. And if the Trump administration is successful in negotiating better trade deals with China and restructuring the terrible NAFTA deal, I believe the best days lie ahead for corporate America and it's labor force. A cautionary word: As I stated in the Q1 Market Update, current investigations of President Trump may "turn out to be a more significant market risk in 2018 than extended valuations, Fed hikes, trade wars, Iran, or North Korea."
From a valuation viewpoint, the market appears fairly priced and trading at about a price-to-earnings (PE) multiple of 24. A PE of 24 may be seen as pricey compared to historical averages and the Cape-Shiller PE median of 16.7, but I think it’s justified by the current era of very low-interest rates and sub-par GDP growth over the past decade. Year to date, interest rates have risen, and as a result the valuation of stocks, as measured by PE ratios, has dropped. If one calculates PE with the FED Model PE Ratio, a 10-year treasury yield of 3% equates to a fair value ratio of 33 (1.0/.03), which is above where the market PE sits now.
*Check out historical PE ratios here.
Lastly, one thing I’ve learned over the years is that the current level of PE ratios, whether trailing 12 months (TTM) or Shiller, has been shown to be a poor guide to market timing and asset allocation shifts. Many investors missed out on the recent market recovery by applying such a methodology. However, buying and holding a diversified portfolio aligned with your personal risk tolerance and values is the best defense against uncertain markets.
Should you have any questions or concerns, please feel free to contact Cambridge Wealth Management.
Sources: Wall Street Journal Online; Bloomberg News; Investor’s Business Daily; Forbes.com; CNBC News; Seeking Alpha: Reuters News; New York Times.
The information contained in this piece is intended for information only and should not be considered investment or tax advice. Please contact your financial adviser with questions about your specific needs and circumstances.
The information and opinions expressed herein are obtained from sources believed to be reliable, however their accuracy and completeness cannot be guaranteed. All data are driven from publicly available information and has not been independently verified by Cambridge Wealth Management, LLC. Opinions expressed are current as of the date of this publication and are subject to change. Certain statements contained within are forward-looking statements including, but not limited to, predictions or indications of future events, trends, plans or objectives. Undue reliance should not be placed on such statements because, by their nature, they are subject to known and unknown risks and uncertainties.
INDEX DESCRIPTIONS:
The past performance of an index is not a guarantee of future results.
The following descriptions, while believed to be accurate, are in some cases abbreviated versions of more detailed or comprehensive definitions
available from the sponsors or originators of the respective indices. Anyone interested in such further details is free to consult each such sponsor’s or originator’s website.
Each index reflects an unmanaged universe of securities without any deduction for advisory fees or other expenses that would reduce actual returns, as well as the reinvestment of all income and dividends. An actual investment in the securities included in the index could require an investor to incur transaction costs, which would lower the performance results. Indices are not actively managed and investors cannot invest directly in the indices.
S&P 500®: Standard & Poor’s (S&P) 500®) index. The S&P 500® Index is an unmanaged, capitalization-weighted index designed to measure the performance of the broad US economy through changes in the aggregate market value of 500 stocks representing all major industries.