asset management

COVID-19 Investment Playbook – CWM Special Report

Market corrections happen, but the speed of this decline was the fastest 10%+ one since the Great Depression. The extreme whipsaw moves we witnessed occurred because the market is attempting to reprice risk assets based on outcomes ranging from a brief pause in Q2 economic growth to a global pandemic and recession.

Summary

  • While economic risks are rising, I do not believe the U.S. is heading for a recession or prolonged bear market. Given the risks to Q2 earnings, I am lowering our S&P 500 year-end target from 3400 to 3200.

  • The market was overvalued in certain areas as I stated in our Market Outlook: Investment Themes for 2020, but valuations are not as stretched as they were during the housing bubble and dot-com era. This is not a 2000- or 2008-style correction.

Don’t bet against the Fed

As my brother Michael, an astute economist, stated on March 1: “We are witnessing a supply-driven shock that the world has never experienced before. There’s no playbook for this one.” The novel COVID-19 virus continues to spread outward from China causing widespread fear. The good news is that the Fed and other central banks were proactive, instead of reactive, and moved this past week to stabilize markets by providing additional liquidity. However, it’s not enough. The Fed and the Whitehouse need to embrace a "whatever it takes" mentality. Trading algorithms need to shift from “what if” to “what will” scenarios and this requires a clear plan from our government.

Some market pundits have criticized the Fed’s recent move because they believe monetary policy cannot cure a non-financial “black swan-type” event. However, lower rates will help interest rate-sensitive companies refinance debt — companies that otherwise could find themselves in violation of debt covenants. There are trillions of dollars of debt owed by businesses and refinancing could help a company weather the current storm, potentially taking advantage of opportunities as animal spirits get stirred.

Collapsing oil prices, empty malls, and idling airplanes will have cash flow implications, which could lead to a slowdown in business spending and bankruptcies. However, it’s an overreaction by markets to assume that the global downturn caused by a supply-driven shock and Wuhan virus could lead to a major credit event.
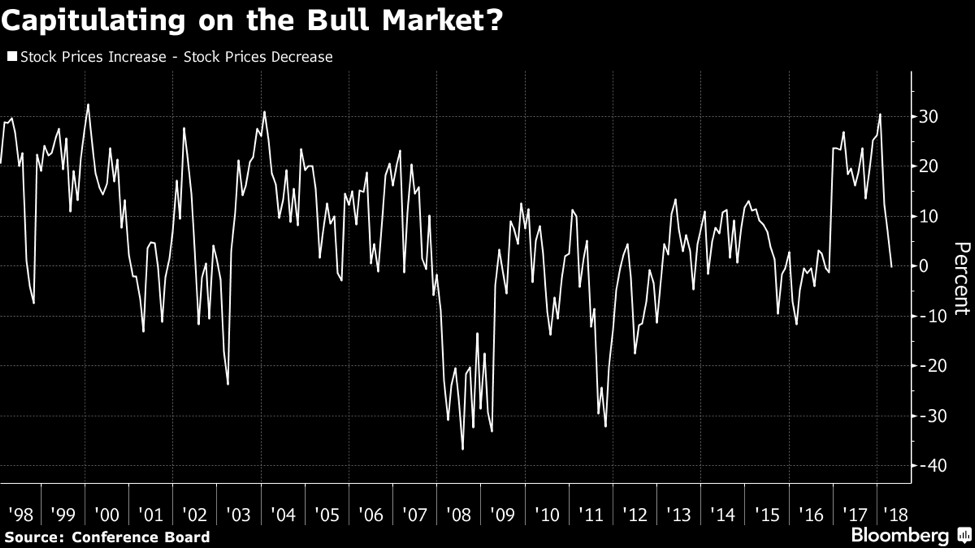
Corporate Profits

Corporate profits likely will come under severe pressure around the world in the months ahead. The sudden oil price collapse and bond market are signaling a global recession. Many market participants fear that we could see more market capitulation in the near-future as Wall Street analysts lower their estimates.

Analysts had conservative forecasts heading into 2020. I noted in Market Outlook: Investment Themes for 2020 that, according to FactSet Earnings Insight, January 10, 2020, “Targets & Ratings: Analysts Project 6% Increase in Price Over Next 12 Months. The bottom-up target price for the S&P 500 is 3,474.50.

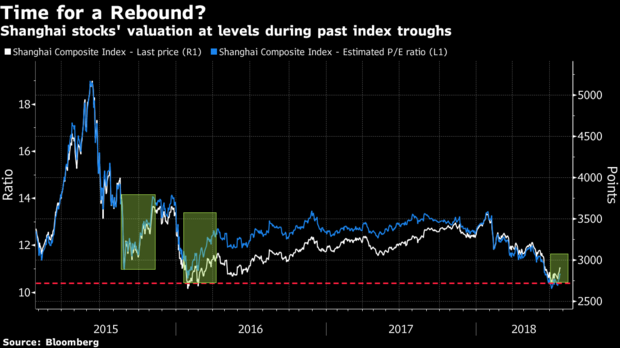
Valuations: Cheap or trapdoor?

Investors may be wondering whether the pullbacks represent buying opportunities or a “value trap” that could lead to more losses. While valuations are more attractive than they were a few weeks ago, it’s a secondary consideration to economic fundamentals, which continue to deteriorate.

I continue to reevaluate tactical positions in light of these current weakening fundamentals. Certain investment themes and names that I liked a month ago look even more appealing now. However, longer-term shocks to supply-and-demand could lead to lower valuations for stocks as investors discount future earnings more aggressively due to persistently slower growth.

Strategy and outlook

Time vs. timing the market

We could remain in a choppy market environment for months. Cambridge model portfolios held high cash positions relative to their strategic asset allocation heading into this market meltdown.

I stated in Market Outlook: Key Investment Themes for 2020 that the market was overvalued and current exuberance needed a healthy dose of reality. However, positioning portfolios to their fully invested strategic asset allocation will depend on the containment of the COVID-19 virus over the coming weeks, improving market fundamentals, and a coordinated, clear plan from the White House.

JP Morgan’s global asset strategist, Marko Kolanovic, said in a note to clients on Wednesday: “The hit to the global economy during the first quarter will largely be made up later in the year. The world economy will bounce back quickly from the coronavirus outbreak, and investors should buy into cyclical stocks to catch the comeback.” Indeed, when we do see an eventual rebound, I believe deep cyclical sectors and value styles could outperform.

Market bottoms are impossible to time. But, if one focuses on buying great assets at discounted prices while balancing risk and return, Cambridge Wealth Management’s clients will benefit in the long run.

IMPORTANT DISCLOSURES: This information is educational in nature and is not intended to provide specific investment advice, a financial promotion, or an inducement or incitement to participate in any product, offering or investment. Cambridge Wealth Management is not adopting, making a recommendation for or endorsing any investment strategy or particular security. The opinions and information expressed herein are obtained from sources believed to be reliable. However, their accuracy and completeness cannot be guaranteed. All data is driven from publicly available information and has not been independently verified by Cambridge Wealth Management, LLC. Some of the conclusions in this report are intended to be generalizations. Any economic forecasts and statements set forth may not develop as predicted and are subject to change. Undue reliance should not be placed on such statements because, by their nature, they are subject to known and unknown risks and uncertainties. There is no assurance that the views or strategies discussed are suitable for all investors or will yield positive outcomes. Investing involves risks including possible loss of principal.

INDEX DESCRIPTIONS:
The following descriptions, while believed to be accurate, are in some cases abbreviated versions of more detailed or comprehensive definitions
available from the sponsors or originators of the respective indices. Anyone interested in such further details is free to consult each such sponsor’s or originator’s website. Each index reflects an unmanaged universe of securities without any deduction for advisory fees or other expenses that would reduce actual returns, as well as the reinvestment of all income and dividends. An actual investment in the securities included in the index could require an investor to incur transaction costs, which would lower the performance results. Indices are not actively managed and investors cannot invest directly in the indices.

S&P 500®: Standard & Poor’s (S&P) 500®) index. The S&P 500® Index is an unmanaged, capitalization-weighted index designed to measure the performance of the broad US economy through changes in the aggregate market value of 500 stocks representing all major industries.

Market outlook: Investment Themes for 2020

Tokyo Bay

Tokyo Bay

A year ago, few could have imagined the S&P 500 delivering a gain of more than 31.5% in 2019 (including dividends) with flat earnings. Volatility was extreme in Q4 2018 and a sell-off in December 2018 left the S&P 500 near bear market territory (defined as a 20% decline from its closing peak). Accounting for compounding returns, the near 20% decline suffered by the S&P 500 in Q4 2018 required a 25% rebound to get back to even.

Throughout 2019, we went from concerns of a bear market to recovery only to have recession fears resurface in the third quarter as trade friction and China’s slowing economy rattled markets. We began Q4 2019 at about S&P 500 2930 level — the market treaded water, so to speak, for nearly 18 months.


2019 performance for key indices:

Equity market:

• S&P 500: 31.5% (including dividends)
• MSCI EAFE: (index of developed market economies): 22%
• MSCI Emerging Markets Index: 18.5%

Bond market:

• Barclays U.S Aggregate Index: 8.7%
Intermediate-term municipal bonds: 5.7%

Real assets:

• Spot gold returned 18.5%.
• REITs gained more than 20%.
Note: UBS tracks 18 asset classes to include in its year-end investor report, and all asset classes reported positive returns compared to only two in 2018 (cash and bonds).

Apple and Microsoft accounted for nearly 15% (almost half including dividends) of the S&P 500 index returns in 2019.

Top Contributors_2019.png


A change of heart at the Fed

So, what changed to finally break the market’s range-bound movement? Our president stopped tweeting about the U.S.- China trade war. Seriously: Much of the stock market’s gains in 2019 can be attributed to a dramatic policy shift at the Federal Reserve.

In 2018, the Fed raised rates four times, including a December 2018 hike that took its key rate to 2.5%, sending a major shockwave throughout global markets. However, in 2019, the Fed lowered rates three times, in one-quarter percentage point steps, due to concerns over a slowing global economy tied to trade war concerns and lackluster business spending. And for an added safety measure, the Fed announced the buying of Treasury bills in September to stabilize the short-term repo market. The Fed’s intervention injected the market with an extra boost to liquidity and investor confidence.

GDP Chart.png

Gross domestic product (GDP) in the U.S. is expected to slow to about 2.0% in 2020, down from 2.2% in 2019 and well off the “sugar highs” induced by the 2017 tax cut package.


Trade deals Signed

We spent much of the year being whipsawed by the U.S.- China trade war headlines and our president’s erratic tweets on the subject.

As the year came to a close, the House passed the United States-Mexico-Canada Agreement, which is President Trump’s replacement for NAFTA. Equally important, the Trump administration came to a phase-one trade agreement with China. All in all, very welcome news for markets.

Trump’s China tariffs and the uncertainty surrounding them were troubling U.S. businesses that have built supply chains in China or that rely on Chinese imports. Their concerns were a reason U.S. businesses’ capital investment fell throughout the year.

pmi_vs_sp500_2019.png


Looking ahead: Key themes for 2020

Corporate earnings: Paying up

As we enter 2020, markets are riding high. Indeed, the mood is ebullient as we experience a continued “melt-up” in markets. The market rally has been driven by expectations of a snap-back in earnings growth and a synchronized global economic recovery.

Price/earnings (P/E) ratios rose to 18.3 forward earnings for the S&P 500 from 15.6 a year ago. The P/E multiple expansion resulted from a decline in interest rates. Are markets expensive? Multiplying the current P/E of 18.4 times the consensus S&P earnings estimate for 2020 of $177.88 results in an index level of 3,202. Based on these forecasts, the market is overvalued at current levels.

According to FactSet Earnings Insight, January 10, 2020:
Targets & Ratings: Analysts Project 6% Increase in Price Over Next 12 Months. The bottom-up target price for the S&P 500 is 3474.50. At the sector level, the Energy (+12.7%) sector is expected to see the largest price increase, as this sector has the largest upside difference between the bottom-up target price and the closing price. On the other hand, the Information Technology (+1.7%) sector is expected to see the smallest price increase.”

Earnings growth estimates were down drastically this past year. Analysts estimated S&P 500 earnings growth for the year would be around 7.6%, according to FactSet. That number is now about 0.3% or flat.

A key theme to watch in 2020 will be companies ability to continue to grow earnings and meet current expectations.

Portfolio implications for 2020:
Sector profit margins at risk of earning misses are Consumer Staples, Industrials, Technology, Consumer Discretionary, and Basic Materials sectors where 25% tariffs on $250 billion array of Chinese industrial goods and components used by U.S. manufacturers remain in place. Note: The fierce rotation into value that began in September, led by major banks like JP Morgan (a beneficiary of the U.S.-China Trade deal) still has room to run.

Some key earnings forecasts to watch this month: Apple, Amazon, and Boeing.
The market has bid up Apple shares, anticipating strong growth from Services. Some analysts are predicting production cuts in March for the iPhone 11 line (iPhone 11 Pro retails for $1149) in Chinese markets due to low demand and increasing headwinds from aggressive 5g smartphone launches in China by Huawei. Apple has fallen behind Asian competitors in its 5g product launch.

Deglobalization or Fair Trade?

What began as campaign rhetoric became reality when president Trump announced his trade reform agenda at the World Economic Forum at Davos in January 2018. He stated: “The United States will no longer turn a blind eye to unfair economic practices, including massive intellectual property theft, industrial subsidies, and pervasive state-led economic planning. These and other predatory behaviors are distorting the global markets and harming businesses and workers, not just in the U.S., but around the globe…The United States is prepared to negotiate mutually beneficial, bilateral trade agreements with all countries.

A phase-one trade deal is important from a psychological perspective because it removes some of the fog of uncertainty clouding business activity for the current fiscal year. A phase-two trade deal with China will not be negotiated until after the 2020 elections. Going forward, we should see a pickup in capital expenditures.

Overseas, growth continues to be more challenging than in the U.S, but green-shoots are emerging and valuations are attractive. The U.K. is expected to negotiate a favorable trade agreement with continental Europe and a soft-landing for Brexit is now widely anticipated.

Portfolio implications for 2020
Trade wars, tariffs, and talk of more tariffs have created a cautious business atmosphere, restraining investment, and concomitant global growth. While a phase-one deal has provided clarity for businesses, trade will remain a top policy issue throughout 2020 and beyond.

In November 2019, the FCC labeled Huawei and ZTE a national security threat and cut Federal funding going to equipment from these companies. Huawei, now the world’s largest telecommunications equipment manufacturer and second-largest smartphone manufacturer, is currently appealing the ban, deeming it unconstitutional. Additionally, the Trump administration has banned U.S companies from doing business with Huawei. In November, the U.S gave Huawei a third 90-day support window that allows current Huawei customers to continue to receive support for existing devices from U.S companies who apply for a “general export license.” The U.S. is also requesting Meng Wanzhou, Huawei’s CFO, be extradited and tried for fraud.

Huawei map.png

Countries and companies that rely heavily on exports who adapt quickly to this changing trade dynamic as they plan capital expenditures and rethink their supply chains will fare better than those who don’t. Earnings for Google Mobile Services(GMS) and certain semiconductor manufacturers could be negatively impacted should the U.S. fail to grant Huawei a fourth 90-day support window. Note: Chinese companies stockpiled U.S. semiconductors in 2018, but inventories are now running low. Huawei is developing their own mobile services, called HMS, to replace Google.

The Fed and Central Banks: On hold?

It appears the recent rate cuts by our Fed have been enough to extend the economic cycle. Bond yields generally remain in their lowest decile relative to history thanks to easy monetary policy and subdued credit conditions. While the Fed is usually on hold during an election year, it may be forced to cut rates again due to concerns over a slowing economy and cautious business spending.

Portfolio Implications for 2020
Interest rates should remain range-bound with the 10-year U.S. Treasury bond trading between a yield of 1.75% and 2.0%. The current rate environment will continue to support an elevated P/E ratio of 18. Companies should continue to take advantage of low rates and buy back shares of their stock, helping boost prices as supply is reduced. Unlike the rally in 2019, Bond returns will likely remain constrained due to dovish central banks and soft global growth. Investors should stick with investment-grade corporates for taxable accounts and avoid reaching for yield this late in the cycle.

U.S. Elections: Facebook, Google, Healthcare, and Energy in focus

First, a word about impeachment. The consensus view is that the current situation is similar to president Bill Clinton's impeachment in 1998, which didn’t affect markets. Perhaps the current impeachment proceeding is more about the Democrats taking control of the Senate? Four Republican senators are at risk: Martha McSally (Arizona), Cory Gardner (Colorado), Joni Ernst (Iowa), and Susan Collins (Maine).

As always, the big wild card to market forecasts this year will be the 2020 elections, though markets likely won’t focus on this X-factor until June. I should note, even though the market’s performance has generally been positive in election years, the gains usually come later.

Many things are going right. With central banks now acting in sync with each other and new trade deals in place, talks of a synchronized global recovery have resurfaced. Improving corporate earnings, business confidence, and an accommodative Fed should help drive market gains in 2020. In all, I expect a good year for financial markets, but as always, I’m prepared for the inevitable surprises that could impact my outlook. Trade frictions with China centered on Huawei and their CFO could heat up again in March as business support exemptions expire, giving current exuberance a healthy dose of reality.

IMPORTANT DISCLOSURES: This material is for general information only and is not intended to provide specific advice or recommendations for any individual. The opinions and information expressed herein are obtained from sources believed to be reliable. However, their accuracy and completeness cannot be guaranteed. All data is driven from publicly available information and has not been independently verified by Cambridge Wealth Management, LLC. Opinions expressed are current as of the date of this publication and are subject to change. Some of the conclusions in this report are intended to be generalizations. There is no assurance that the views or strategies discussed are suitable for all investors or will yield positive outcomes. Investing involves risks including possible loss of principal. Any economic forecasts set forth may not develop as predicted and are subject to change.

INDEX DESCRIPTIONS:
The following descriptions, while believed to be accurate, are in some cases abbreviated versions of more detailed or comprehensive definitions
available from the sponsors or originators of the respective indices. Anyone interested in such further details is free to consult each such sponsor’s or originator’s website. Each index reflects an unmanaged universe of securities without any deduction for advisory fees or other expenses that would reduce actual returns, as well as the reinvestment of all income and dividends. An actual investment in the securities included in the index could require an investor to incur transaction costs, which would lower the performance results. Indices are not actively managed and investors cannot invest directly in the indices.

S&P 500®: Standard & Poor’s (S&P) 500®) index. The S&P 500® Index is an unmanaged, capitalization-weighted index designed to measure the performance of the broad US economy through changes in the aggregate market value of 500 stocks representing all major industries.

U.S.-China Trade War: Could it get any uglier?

A day will come when there will be no battlefields, but markets opening to commerce and minds opening to ideas.
— Victor Hugo

Trade tensions between the United States and China show no signs of simmering down. A new round of U.S. tariffs on Chinese imports kicked in on August 22. The U.S. began collecting an additional 25 percent in duties on $16 billion in Chinese import product categories including semiconductors, chemicals, and motorbikes, just to name a few. These latest American tariffs come on the heels of $34 billion in Chinese goods duties levied at 25 percent, which were implemented in July.

Beijing immediately retaliated with tariffs of their own on $16 billion worth of additional imports from the U.S. including fuel, steel products, autos, and medical equipment.
 

In brief:

  • Basic materials, industrials, and emerging markets have all taken a hit in recent months due to the trade wars. Turbulence will be around for awhile particularly in emerging markets.

  • Markets should expect bilateral tit-for-tat trade actions to continue for the foreseeable future for both the U.S. and China. With approaching midterms, China is playing a waiting game.

  • The objective is to reduce the size of the U.S. - China trade deficit from an estimated $370 billion to $200 billion by 2020 and eliminate unfair trade practices noted below.

August 6, 2018 - prior to recent round of 16b in tariffs

August 6, 2018 - prior to recent round of 16b in tariffs


The issues:

At the core of the trade war issues on the U.S. side are concerns over technology infringement and alleged widespread intellectual property (IP) theft by the Chinese. This comes from three activities:

  • Corporate espionage,

  • Cyber-theft, and

  • Technology transfer to the Chinese in exchange for market access.

The Commission on the Theft of American Intellectual Property estimates that China's purported IP theft costs the U.S. between $225 billion and $600 billion each year. http://ipcommission.org

China has denied Washington's allegations that it essentially forces the unfair transfer of U.S. technology in exchange for market access and insists it adheres to World Trade Organization rules.

Instead of tit-for-tat trade tariff retaliation with the U.S., China should follow South Korea's lead and accept to bring down their large surplus on American trades and rebalance a relationship that has served them so well.


The art of the deal

The prevailing wisdom on President Trump's trade tactics is that he's making major negotiation errors in his attacks on China and that nobody can win a trade war. Regardless of the Trump administration’s current trade war strategy with China, I think that things could change quickly for China in the coming months leading to two very different potential market outcomes in Q4. China wants U.S. business interests to pressure President Trump, and it’s betting on scenario one below.

Scenario 1: A “Blue Wave” in the House this November gives the Democrats a mandate to impeach Trump if the Special Counsel report proves some form of perjury or Russian collusion. President Trump is likely to survive indictment in the Senate, but "Never Trump" Republicans could vote to replace him with Vice President Mike Pence. Note: The billionaire Koch brothers have financed the Vice President’s political career, and therefore, he would likely carry their “free trade” globalist torch.

Scenario 2: The Special Counsel finds no Russian Collusion or wrongdoing by the Trump administration, there’s a “Red Wave” in November midterms, and President Trump is given the mandate to move forward with his populist agenda and impose tariffs on a total of $500 billion of Chinese imports.

So, what’s the real U.S. endgame in this trade war with China? It's this: Redirect global supply chains to favor American manufacturers; pressure China to open its market to Americans with no strings attached; reduce the trade deficit, and challenge Chinese dominance in Asia.
 

The bottom line:

Shangai index 620x-1.png

China's President Xi Jinping is feeling the heat and it looks like he may have overreached. Trade tensions have exposed vulnerabilities in China's slowing economy, and it’s making investors nervous. A tanking Chinese stock market and resulting investment outflows could lead to an uptick in emerging market bond yields and the winter of discontent in China. Even worse, a full-blown trade war would have stagflationary consequences globally.

A few days ago, veteran Wall Street trader Art Cashin of UBS mentioned on CNBC that markets seem to be pricing in the “Pence Put.” A put is a option contract giving the owner the right to to sell a specified amount of an underlying security at a specified price within a certain time frame, limiting downside market risk. Either the market is looking beyond the trade war and midterm elections and pricing in a "Pence Put" or it's having a lagging reaction to significant regulatory rollback and Trump's Tax Cuts and Jobs Act of 2017 (TCJA).

The future is capricious (especially in the Trump era), which is partially the reason why markets exist in the first place. The market conditions that led to February’s spike in the VIX (volatility index) — rising rates, less liquidity, and hedge funds being caught wrong-footed — are still there. With the unprecedented confluence of political and trade events added to these pre-existing conditions, the likelihood of a spike in volatility calls for underweighting equities relative to their strategic asset allocation and holding higher levels of cash. Depending on the outcome of the November midterms and the Mueller investigation, the U.S. - China trade war could get even uglier in the months ahead as trade policy scripts get torn up and rewritten.
 

Sources: Wall Street Journal Online; Bloomberg News; Investor’s Business Daily; Forbes.com; CNBC News; Reuters News; The Economist.

The information contained in this piece is intended for information only and should not be considered investment advice. Please contact your financial adviser with questions about your specific needs and circumstances.

The information and opinions expressed herein are obtained from sources believed to be reliable, however their accuracy and completeness cannot be guaranteed. All data are driven from publicly available information and has not been independently verified by Cambridge Wealth Management, LLC. Opinions expressed are current as of the date of this publication and are subject to change. Certain statements contained within are forward-looking statements including, but not limited to, predictions or indications of future events, trends, plans or objectives. Undue reliance should not be placed on such statements because, by their nature, they are subject to known and unknown risks and uncertainties.

Q2 2018 Update: Volatility is back!

Bearish or Bullish.jpg
The stock market serves as a relocation center at which money is moved from the active to the patient.
— Warren Buffet

After a strong start to the year in January, volatility returned with a vengeance in early February just as our new Federal Reserve chairman, Jerome Powell, took control of the central bank. The entry of a new Fed chairman was followed by two high-profile exits in the Trump administration: economic advisor Gary Cohn and Secretary of State, Rex Tillerson. Markets prefer certainty, and with both Cohn and Tillerson gone, many now believe there isn’t anyone left to keep President Trump in check. Additionally, investors are losing faith in markets as President Trump ramps up his combative anti-trade rhetoric.


In Brief:

  • The 10-year treasury finally hit 3% this week — the first time since the taper tantrum of 2014. Algorithms “sold the news” and set into motion a further sell-off to start Q2.

  • Markets now fear that the Fed will raise rates at least three more times in 2018, pushing the economy into recession in 2019. Contrary to consensus, I believe the Fed will raise rates only twice in 2018 and is under no pressure to aggressively lift interest rates.

  • Many research analysts contend that the boosts from Trump’s tax cuts are largely priced into the market and the highs were made in January. It's easy to factor in new corporate tax rates but future demand expectations are always difficult to forecast. Cambridge Wealth Management’s year-end target for the S&P 500 for 2018 remains 2850.

Picture1.png

Volatility is baaack. In January, I mentioned that the “FAANG Stocks “focus (Facebook, Amazon, Apple, Netflix, and Google) remains a worry for me in 2018. The relentless advance in the market in 2017 was largely fueled by a handful of glamorous mega-caps. In fact, a recent analysis shows that nearly 40% of last year’s gain in the S&P 500 can be linked to just four stocks.” New York Times contributor, Norm Alster, pointed out in a January 12, 2018 article (click): “FAANG stocks made up just 6 percent of the S.&P. 500 in 2013. By the end of last year, they accounted for 12.3 percent.”

As Facebook and Google face the potential for new regulations to protect consumer privacy and prevent suspected foreign intervention in our future elections, volatility in the FAANG stocks has picked up and exacerbated moves to the downside in the market indices. In a September 2017 post on the Cambridge Wealth Management Facebook page, I shared the following quote: "The gross idolatry, or mother of all hall passes, that big tech has received from government and from regulators is coming to an end," NYU Stern School of Business professor Scott Galloway told CNBC's "Squawk Alley.”

Currently, the market is searching for new leadership as the once invincible FAANG Stocks have met their kryptonite: potential government regulations. The prospects of increased regulation for social media companies and tight labor markets are giving investors reason for pause because it means changes in future earnings that result in diminishing risk-adjusted returns. And it couldn’t come at a worse time as the list of political obstacles for the market continues to pile up, such as a potential Democratic sweep in the November midterm elections and a trade war with China. With so much uncertainty, we are simply entering a period of “risk-off” in global markets. We are not entering a recession or a bear market.

According to the Investment Company Institute, outflows from U.S. equity mutual funds and exchange-traded funds totaled $41.3 billion in February. That's the most by a dollar amount since a $42.8 billion outflow in January 2008. So, while earnings are failing to impress investors and the markets show continued signs of volatility, I believe reduced burdensome regulations, lower tax rates, higher wages, improving corporate and personal balance sheets means the market’s best days are in front of us. Just as in Q1 2018, a record number of S& P companies are beating earnings again. Check out these recent numbers published on April 23 by John Butter’s of Fact Set:

“It appears the lower tax rate is more than offsetting any impact of higher wages and other rising costs, resulting in a record-level net profit margin for the index for the first quarter. It is interesting to note that analysts expect even higher net profit margins for the remainder of 2018 for the S&P 500. Based on current earnings and revenues estimates, the estimated net profit margins for the second, third, and fourth quarter of 2018 are 11.5%, 11.8%, and 11.7%, respectively.”

Inflation Concerns

Picture2.png

From 2014 to 2016, inflation expectations tumbled as the oil glut and the Saudi's efforts to drive U.S. producers out of business pushed crude below $30 by early 2016. The recovery in the price of oil helped fuel gains in 2017 but it appears the high is now in for oil and its presenting a headwind for further market gains. Oil should resume its longer-term trend lower over the next few years. The graph above illustrates that inflation concerns over the near-term maybe overblown. However, the headline is changing. For years, our Fed was worried about deflation, and now it’s focus is shifting to inflationary concerns.

Historically, in the late stages of a bull market, the economy shows signs of overheating, inflation continues to climb higher, stock prices look expensive compared to earnings, and the Fed continues to raise rates aggressively. Late-stage cycle sectors to invest in include energy, utilities, healthcare, and consumer staples. Other than a recent surge in energy stocks, healthcare and consumer staples sectors are performing poorly. Therefore, it does not appear that we are in the 7th, 8th or 9th inning of a late-stage bull market (many pundits like to use this baseball terminlogy to describe market cycles). The length of this bull market (as compared to previous bull markets) is an irrelevant comparison.

Famed investor Louis Navellier sums up the performance of the markets since 1999 in a January 2018 Seeking Alpha post titled: “The S&P 500 has gained only 3.4% since 2000.” In it, he notes:

“When pundits talk about the soaring stock market this year, last year, and the last nine years, they forget to mention the nine dismal years before 2009. If you take the full 18 years from the end of 1999 to the end of 2017, the S&P 500 has only risen 82%, which works out to only 3.4% per year, annualized.”

Over the past decade, America has experienced the weakest economic recovery in history. GDP growth averaged 1.26%, worse than the Great Depression’s growth rate of 1.37%! (Granted, not a fair comparison but I thought it was worth noting). There is plenty of room for improvement going forward as American’s experience improved wages for all, not just the top 1%.
 

Fixed Income

Market Milestone_10-yr T @3%.png

A market milestone is reached this week - 3% 10-year treasury

Markets are now concerned that our new Fed chairman, Jerome Powell, will prove to be a “hawk” and aggressively raise interest rates. Many financial experts point to the flattening yield curve as a leading indicator of a looming recession or "soft patch" in 2019. The economy is getting unprecedented fiscal stimulus from the Tax Cut and Jobs Act of 2017 at a time when the Fed is raising rates, and the federal debt has begun spiraling upward.
*For a deeper explanation of the "yield curve tell," check out this piece by me posted in February 2017.

Contrary to Wall Street’s consensus view, I think the Fed will raise rates only two times this year. While inflation, wage growth, and the economy show signs of picking up, it’s not overheating, allowing the Fed to gradually raise rates this year and in 2019.

Additionally, both the European Central Bank and the Bank of Japan are not planning rate hikes, and their buying of our treasuries along with foreign capital seeking better returns could put a lid on further rate increases for the balance of the year.

My view is that the 10-year Treasury yield could rise to 3.5% within a year as the Fed follows a steady and slow path of tightening.

At Cambridge Wealth Management, we continue to favor a short-duration laddering strategy of investment-grade corporate bonds and CDs on the short-end. Investors are finally getting paid to hold CDs as 6-month paper approaches 2%. And select 2023 BBB-rated financial paper is close to yielding 4% again.

Note on Municipal bonds: The new $10,000 limits for deducting state tax against one’s Federal tax makes municipal bonds even more attractive to wealthy individuals living in high-tax states like California, Connecticut, New York, New Jersey, and Maryland. The two categories that look are appealing within the muni space are the top ten U.S. ports and airports.


The Bottom Line:

So far this earnings season, a lower tax rate for corporate America is more than offsetting any impact of higher wages and other rising costs, resulting in a record-level net profit margin. But given the recent breakdown in leadership from the FAANG group, concerns over mistakes by a new Fed Chairman, and ever-changing, worrisome tweets from our president, the market has a reason for pause as it sells the good news and reevaluates risk premia. However, I remain reasonably optimistic on the market with a year-end target of 2850 for S&P 500.

From a technical standpoint, the U.S. market is showing signs of support at S&P 500 2600 and further downside risk seems muted. And if the Trump administration is successful in negotiating better trade deals with China and restructuring the terrible NAFTA deal, I believe the best days lie ahead for corporate America and it's labor force. A cautionary word: As I stated in the Q1 Market Update, current investigations of President Trump may "turn out to be a more significant market risk in 2018 than extended valuations, Fed hikes, trade wars, Iran, or North Korea."

From a valuation viewpoint, the market appears fairly priced and trading at about a price-to-earnings (PE) multiple of 24. A PE of 24 may be seen as pricey compared to historical averages and the Cape-Shiller PE median of 16.7, but I think it’s justified by the current era of very low-interest rates and sub-par GDP growth over the past decade. Year to date, interest rates have risen, and as a result the valuation of stocks, as measured by PE ratios, has dropped. If one calculates PE with the FED Model PE Ratio, a 10-year treasury yield of 3% equates to a fair value ratio of 33 (1.0/.03), which is above where the market PE sits now.
*Check out historical PE ratios here.

Lastly, one thing I’ve learned over the years is that the current level of PE ratios, whether trailing 12 months (TTM) or Shiller, has been shown to be a poor guide to market timing and asset allocation shifts. Many investors missed out on the recent market recovery by applying such a methodology. However, buying and holding a diversified portfolio aligned with your personal risk tolerance and values is the best defense against uncertain markets.

Should you have any questions or concerns, please feel free to contact Cambridge Wealth Management.


Sources:
Wall Street Journal Online; Bloomberg News; Investor’s Business Daily; Forbes.com; CNBC News; Seeking Alpha: Reuters News; New York Times.

The information contained in this piece is intended for information only and should not be considered investment or tax advice. Please contact your financial adviser with questions about your specific needs and circumstances.

The information and opinions expressed herein are obtained from sources believed to be reliable, however their accuracy and completeness cannot be guaranteed. All data are driven from publicly available information and has not been independently verified by Cambridge Wealth Management, LLC. Opinions expressed are current as of the date of this publication and are subject to change. Certain statements contained within are forward-looking statements including, but not limited to, predictions or indications of future events, trends, plans or objectives. Undue reliance should not be placed on such statements because, by their nature, they are subject to known and unknown risks and uncertainties.

INDEX DESCRIPTIONS:
The past performance of an index is not a guarantee of future results.

The following descriptions, while believed to be accurate, are in some cases abbreviated versions of more detailed or comprehensive definitions
available from the sponsors or originators of the respective indices. Anyone interested in such further details is free to consult each such sponsor’s or originator’s website.


Each index reflects an unmanaged universe of securities without any deduction for advisory fees or other expenses that would reduce actual returns, as well as the reinvestment of all income and dividends. An actual investment in the securities included in the index could require an investor to incur transaction costs, which would lower the performance results. Indices are not actively managed and investors cannot invest directly in the indices.

S&P 500®: Standard & Poor’s (S&P) 500®) index. The S&P 500® Index is an unmanaged, capitalization-weighted index designed to measure the performance of the broad US economy through changes in the aggregate market value of 500 stocks representing all major industries.


China's currency reset is a game-changer

Don’t ask me where things are the best. That’s the wrong question. Ask me where things are the most miserable.
— Sir John Templeton

There was really no new economic data here in the U.S. to justify the 1,000 point slide in the Dow Jones on Monday, August 24 after a 500 plus decline the prior Friday. So what caused such a dramatic plunge? Every self-professed market expert on CNBC has an answer but no one really knows. Some of the explanations I find compelling are China’s currency devaluation and the markets simply being pricey — as in all market corrections, investors were merely selling as prices kept falling. 

One fact is certain: we learned this past week that the US is not as insulated as we thought from China’s slowdown and the continued economic malaise facing emerging markets. After all, global consumption for every commodity has been driven by China and largely supplied by many emerging markets.

China devalues
Fears that economic conditions in China are worse than investors originally thought resurfaced when the People's Bank of China (PBoC) decided to suddenly reset its currency. This move sent the currency markets into chaos and was cause for investors to reevaluate all risk assets. Indeed, the poor communication from the PBoC over China's currency intentions has been a key cause of financial market turbulence.

I believe China’s currency devaluation was a game-changer for global markets. The sudden move by the PBoC has negative effects for companies with significant production in China. It could also be an even greater drag on U.S. multinationals earnings growth by reducing China's demand for our exports.

Conversely, by devaluing its currency, China intends to regain competitiveness and boost its exports. I have provided a link below to a recent Bloomberg News QuickTake article entitled "The People's Currency: Freeing China's Yuan" — it provides an excellent historical synopsis and further explanation behind China's recent currency reset.

A Relapse of Investor P.T.S.D.
Investor confidence, once again, has been damaged by extreme market volatility, just as it was during the “flash crash” on May 6, 2010. And while it's been almost seven years since the financial crisis of 2008, many investors have yet to recover from the trauma of the near collapse of our financial system. Do you remember that between October 2007 and March 2009, the U.S. stock market dropped in price by over 50%?

Panic set in on Monday as markets were abruptly awakened from their summer of complacency. In an Investor’s Business Daily editorial, Stephen Porpora, a member of the NYSE for 31 years, made the following observation — “It's not that markets went down — it's how they went down. Certainly, fears of a China slowdown, devaluation, etc. are real. Yet, Monday's volatility was such a wild ride that even seasoned traders and financial news commentators were left shaking their heads. As just one vivid example, KKR & Co., the asset management firm, traded from a high of $19.43 to a low of $8.00 and closed at $19.50 on Monday, August 24th. Yikes!"

Market volatility reached levels that we haven’t seen since 2011
On Monday, the CBOE volatility index (often referred to as the “Fear Index”) surged and crossed the 50 level for the first time since February 2009. Sudden spikes, like those illustrated in the chart below, are not to be taken lightly--they are not just indicative of “manic” market behavior or panic-selling. Indeed, I take such market behavior very seriously.

Source of chart: CNBC.com

Source of chart: CNBC.com

Now for some positive news...
On Wednesday, August 27, The U.S. Commerce Department released revised GDP estimates for the second quarter -- the economy grew at an annual pace of 3.7% vs. the original estimate of 2.3%. The market recovered another 369 points on the Dow by the close on Thursday after closing up 600 points on Tuesday and the S & P closed up 47 points or 2.43%. Here are some more economic positives to ponder:

  • The U.S. should continue to be the engine for global growth—economists surveyed by Bloomberg expect annual GDP to average 2.3% this year.
     
  • The US consumer is doing modestly better – housing is stable and showing signs of strength –much needed at this juncture. Signs of overdone credit expansion are absent from this cycle.
     
  • While the market was overvalued in certain areas, such as biotech and industrials, valuations are not as stretched as they were during the housing bubble and dot com era.

Unless market turmoil continues and undermines business sentiment, I believe this past week is just a healthy market correction. However, the market could continue to struggle in the coming months as it reassesses risk asset valuations against the backdrop of future U.S. interest rate hikes, China's slowdown, and signs of peaking U. S. corporate earnings. 

Our bottom line
Stock prices follow earnings and the path of corporate profits over the next few quarters will tell us whether the bear’s claim that stocks have peaked is true. It’s important to remember that investing is about managing risk. Maintaining a globally diversified portfolio that matches your risk profile is critical, especially in the current environment.

It's also important to keep a calm, clear perspective during times of heightened market volatility. Take the time to reassess your investments with your advisor as you may be overweight equities due to strong market performance over the past few years. If you are confident with your advice and holdings, you can avoid capitulating and selling into a panic selloff.

The sudden move by the PBoC to devalue its currency is, indeed, a game-changer for global markets, and we are headed for some heightened volatility. I will continue to be vigilant in the months ahead.

Sources: The Wall Street Journal; Bloomberg News; Investors Business Daily; CNBC.com.

Observations and views expressed herein may be changed at any time without notice and are not intended as investment advice or to predict future performance. It is not an offer, recommendation or solicitation to buy or sell. It is based on information generally available to the public from sources believed to be reliable. Changes to assumptions may have a material impact on any returns detailed. Past performance is not an indication of future returns. Please consult your financial professional before making an investment decision.